[참고 페이지]
https://m.blog.naver.com/bosongmoon/221587219214
https://gomguard.tistory.com/22
지금 설명할 것은,
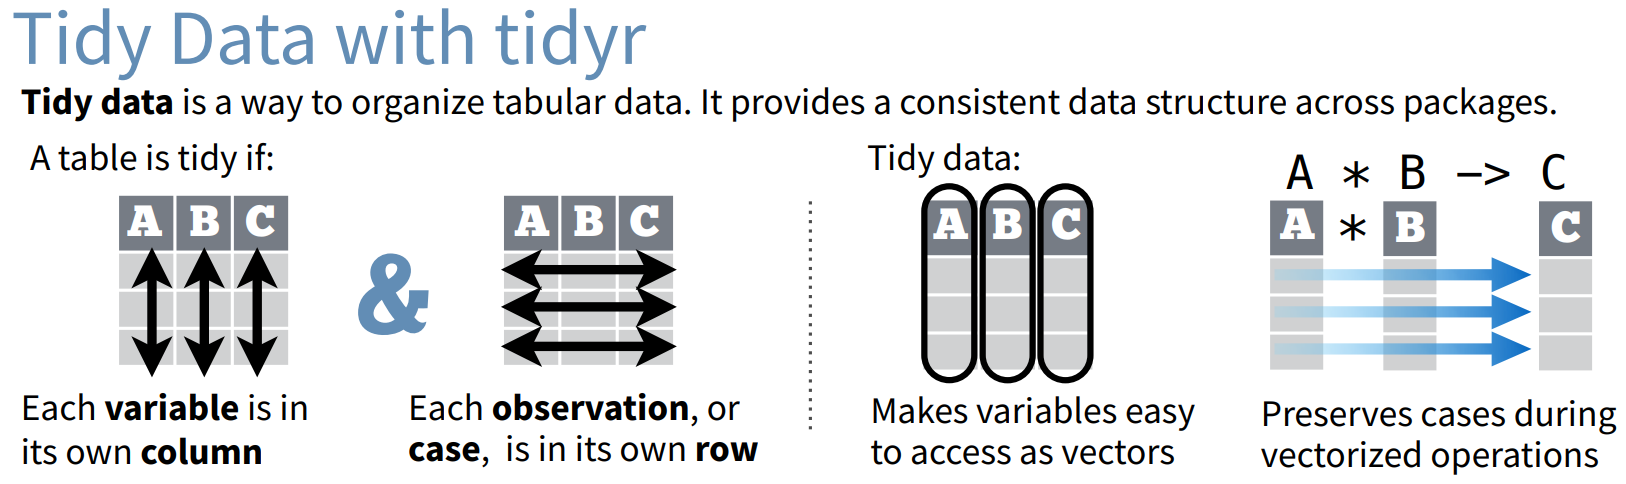
'Reshape data: change the layout of values in a table'에 관련된 두 함수다.
Reshape Data
1. gather(data, key, value, ..., na.rm = F, convert = F, factor_key = F)

table4a %>% gather('1999', '2000', key='year', value='cases')
또는,
gather(table4a, '1999', '2000', key='year', value='cases')
= columns: 1999, 2000을 year로 묶고, 그때의 셀값은 cases로 한다.
2. spread(data, key, value, fill = NA, convert = F, drop = T, sep = NULL)
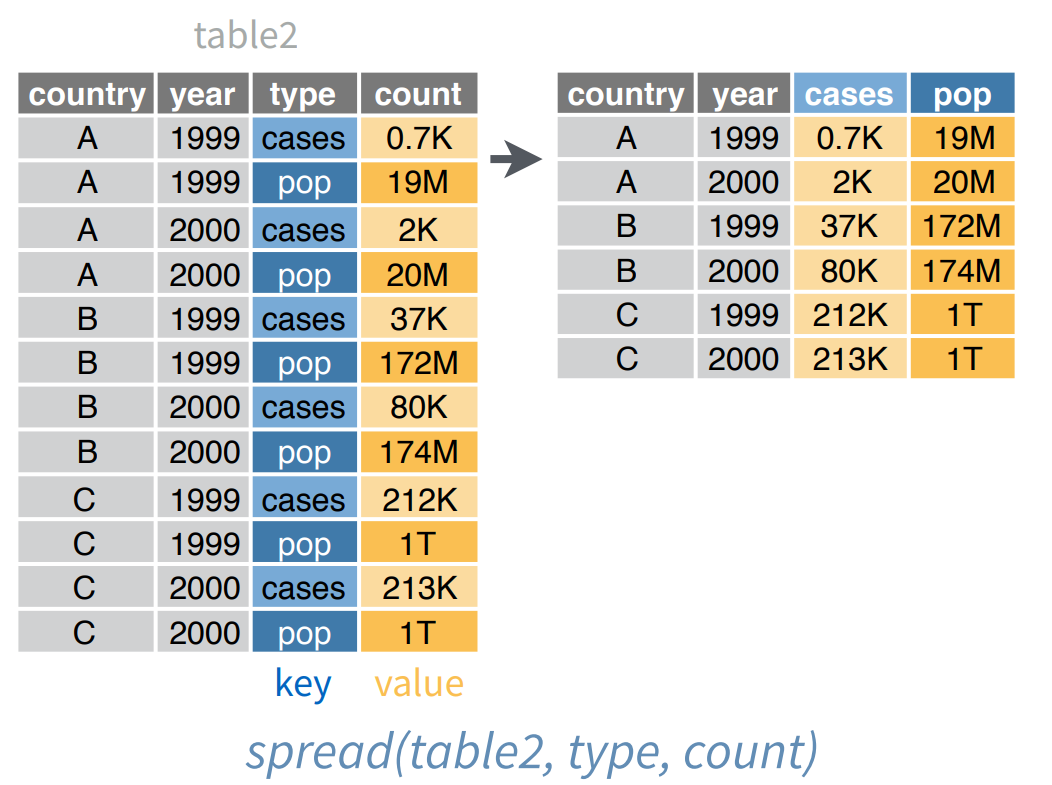
table2 %>% spread(key=type, value=count)
또는,
spread(table2, key=type, value=count)
= type 열 안의 범주를 각각의 열로 옮긴다. 그때 사용할 값은 count이다.
'R' 카테고리의 다른 글
| tidyr:: (3) iris data에 적용해보자 (+pivot_longer) (0) | 2022.07.21 |
|---|---|
| tidyr:: (2) Split or combine: separate, separate_rows, unite (0) | 2022.07.21 |
| 'tidyverse' package (0) | 2022.07.21 |


